Hi guys,
I’m still having big troubles with 3.7.0beta (3.6.4 had the same kind of problem).
Usually the server handles 400 clients during work hours. I’ve seen bigger deployments in others posts, so this is ok.
We have a severe memory leak where the JVM goes up to the 2096MB Java memory limit.
It appears the same thing happens with just a few clients (35 at the time I’m testing).
Clients are essentially Spark/Pidgin.
The server is a Linux/x64 Debian Squeeze with Sun JRE/JDK6, LDAP auth, Database(MySQL) groups.
We have 3 dozen of groups being shared between each 350 users (enterprise groups).
It is connected to another Openfire 3.6.4 server which seems to work correctly (~50 clients, Windows2K3x64/SQLLite).
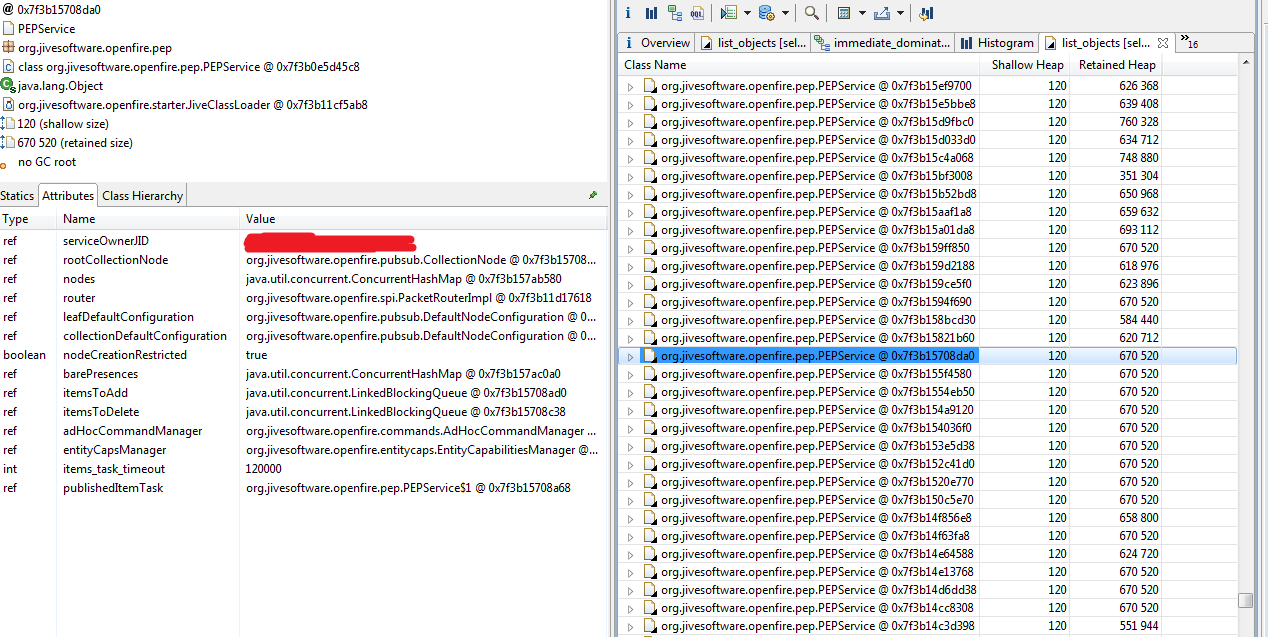
I’ve been able to make a heap dump parsed with Eclipse Memory Analyser (very good soft by the way).
Here are parts of the results(~40 clients)(tested after a fresh start to have the thinest memory footprint) :
One instance of “java.util.TaskQueue” loaded by “” occupies 776 748 384 (90,98%) bytes. The instance is referenced by org.jivesoftware.openfire.pep.PEPService @ 0x7f3b4699f6b0 , loaded by “org.jivesoftware.openfire.starter.JiveClassLoader @ 0x7f3b11cf5ab8”. The memory is accumulated in one instance of “java.util.TimerTask[]” loaded by “”.
Keywords
java.util.TaskQueue
java.util.TimerTask[]
org.jivesoftware.openfire.starter.JiveClassLoader @ 0x7f3b11cf5ab8
Class Name
Shallow Heap
Retained Heap
Percentage
- java.util.TaskQueue @ 0x7f3b12708d88
32
776 748 384
90,98% - java.util.TimerTask[2048] @ 0x7f3b3b254c60
16 408
776 748 352
90,98% - org.jivesoftware.openfire.pep.PEPService$1 @ 0x7f3b367e0ff8
88
671 344
0,08% - org.jivesoftware.openfire.pep.PEPService$1 @ 0x7f3b362a8ff8
88
671 344
0,08% - org.jivesoftware.openfire.pep.PEPService$1 @ 0x7f3b2f38d1a8
88
671 344
0,08% - org.jivesoftware.openfire.pep.PEPService$1 @ 0x7f3b32428918
88
671 344
0,08% - org.jivesoftware.openfire.pep.PEPService$1 @ 0x7f3b31c67928
88
671 344
0,08% - org.jivesoftware.openfire.pep.PEPService$1 @ 0x7f3b1aeb8d00
88
671 344
0,08% - org.jivesoftware.openfire.pep.PEPService$1 @ 0x7f3b171c1328
88
671 344
0,08% - org.jivesoftware.openfire.pep.PEPService$1 @ 0x7f3b1c628250
88
671 344
0,08%
(truncated)
Label
Number Of Objects
Used Heap Size
Retained Heap Size
org.jivesoftware.openfire.pep.PEPService$1
1 157
101 816
776 731 944
The warn log reports a lot of (~1 per minute):
2010.10.21 23:39:54 Cache Roster was full, shrinked to 90% in 0ms
Is it a bug?
Is there a workaround?(property value?)
Is there a patch?