Java-monitor.com has released a new, free Openfire plugin that allows you to monitor your Openfire instance remotely. The plugin will notify you if your server goes off-line. It also allows you to keep a close eye on a number of important health indicators, such as the usage pattern of the Openfire worker threads, JVM memory usage and garbage collection statistics, JVM thread and Openfire’s database connection pool usage.
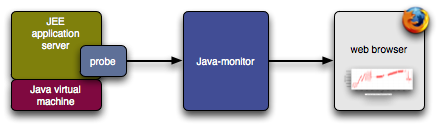
Unlike most monitoring tools, you don’t have to set up a monitoring server yourself for this to work. Java-monitor.com provides the infrastructure to do the monitoring for you. The probe that’s integrated in the Openfire plugin sends statistics to java-monitor.com. Everything else is handled there. You can view the data from their website, as shown below.
To get started, register an account at http://java-monitor.com/install.html. After you’ve registered, you’ll be able to download a personalized Java-Monitor probe package, which includes an Openfire plugin. Add this plugin to your Openfire installation, and you’re done! The plugin will automatically start collecting data. Java-monitor allows you to monitor Openfire from anywhere - all you need is a javascript enabled browser.
Just a quick note to let you know that if you start using Java-monitor today, you will receive 10 free SMS notification credits. So you can try out the new SMS feature for free. Be quick, the offer ends at September 30th 2009.
I have already posted one issue in your forums. After my server is stopped and started again, then new instance is shown on your site. So now, there are 2 instances of my server. I havent tested further, but maybe it will add one after every restart.
I am in the process of changing the probe’s port detection mechanism for Openfire servers. The startup times for Openfire servers are several seconds and from what I see in the traces the ports are opened fairly late in the process. So I have added some logic to wait until it looks like to server is fully operational before starting to push data to the collector server. This is nothing strange. The probe already has similar wait logic for Tomcat and JBoss servers. It wasn’t reported on Openfire before.
I’ll let you guys know when I have the new probe version ready and tested. Probably tomorrow.
Meanwhile, can I ask your opinion on what you think of the information Java-monitor displays from your Openfire server? Presently, you see lots of JVM graphs and the packet counter graph. What else would be useful (and why)?
The information displayed is more than enough and the graphs are useful. Seeing the memory usage and DB polls allows you to know about the machines’ whereabouts quite well. It’s interesting to see (for instance) how used memory varies as the garbage collector does its job.
I don’t know if it may be feasible, but showing the number of connected xmpp users to the server would be awesome. Again, it would allow users to check how the machines perform as activity increases.
I just took a look at the API, and it looks like that’s the total ammount of registered users… Maybe it should be the active sessions count, or something similar. I’ll ask around here to see if someone knows.
However, maybe the number of users could be used to draw a line (in a similar way to the heap mem max) in the graph.
Well. I will check and try the newer version, but personally i dont think i will use this on my production server. It runs perfectly for months 7/24 and i dont see a point to monitor anything And there were almost nothing to see on my testing server. So, that’s it Also some information is available in Monitoring Service plugin. Although it saves everything in the database and it is not very convenient, as database grows.
I just uploaded a new Openfire plugin to the Java-monitor servers. Could you please remove your old plugin and download and install the new one from java-monitor.com? This should fix the host-duplication-on-restart issues you have been seeing. If you have time, could you please restart the OF server a few times to see that it does not replicate anymore?
Well, if you have the luxury of running OF servers free of problems you indeed have no use for monitoring. I agree that for your case it makes little sense to install a monitoring plugin if you never get a notification.
That is one of the advantages of running OF over JEE servers. It is a relatively easy to get stable and people don’t futz with it as much. JEE servers see new releases of the web apps and need retuning every release.
Still, there are plenty of non-Openfire and non-Java reasons a server may go down. Hardware dies (I have had a bad batch of disks for Java-monitor) and hosters unplug switches accidently to get a socket free for the hoover.
I just uploaded the new plugins to the production servers (as oposed to wroot, I preffer to have them monitored ), and it’s not doing duplicates anymore.
Now the question is: how do I get rid of the old duplicate servers that still appear in the java-monitor page?
On the host page there is a tiny trashcan icon in the graphs page of the host you want to delete. Click that, or wait a month or so, when the host is automatically purged due to inactivity.
 Be quick, the offer ends at September 30th 2009.